Astromets Mind now has a Minor League Guts
page (there’s a permanent link at the top of the page), with linear weights and
park factors from 2011-2015, presented as Fangraphs does their Guts page. Now that the
numbers are up, I wanted to investigate how the Mets minor league parks played in
2015, and look for trends from the past 5 seasons. If you want a better idea of league context for the numbers below, I
looked at the 2015 scoring environments of all affiliated leagues in my last
post.
Park factors can give us a good
idea of how a stadium played relative to the league, but it’s still more
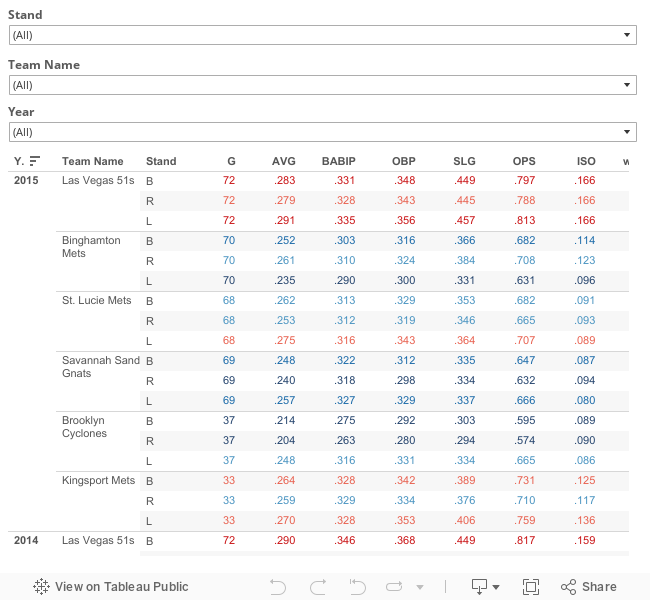
intuitive to look at rate stats, so I’ve included a Tableau worksheet with rate
stats for each home park in the Mets system over the past 5 seasons (note, these are home park
splits, not home team splits). I’m not including GCL data here, and I’ve
included 2011-12 data for the Las Vegas 51s instead of the Buffalo Bisons
because the Buffalo information would not really be relevant. I’ve also included
a worksheet that allows you to look at wOBA by batted ball type for each of the
Mets minor league stadiums over the past 5 seasons.

Las Vegas 51s – Cashman Field, Las Vegas, Nevada
 |
| Cashman Field at sunset |
The
Mets have now played in the hot Las Vegas desert 3 seasons in a row, with
Cashman Field playing as a higher than average scoring environment in the PCL,
which is itself a high run scoring environment. The stadium has short porches
in the corners – 328 ft to LF and 323 ft to RF – but extends out to 433 ft in
CF, and has tall walls. Las Vegas has an average elevation of ~2,000 feet above
sea level, so you’d expect fly balls to do well, and the wOBA_FB at Cashman had
been consistently around .490, which is above average, until this past season. The
park has favored lefties slightly, but both sides flourish at Cashman. Some
nights get extremely windy, which can make every fly ball a potential mistake
for the outfielder (or a homerun for the batter when it’s blowing out), and
always leads to wild but fun games.
The 51s have reportedly made
big improvements to their infield maintenance over the past two seasons,
but it’s likely still one of the ‘quickest’ infields in affiliated ball, which
helps increase BABIP. 2015 was a 5-year low for BABIP at Cashman, so perhaps
the infield maintenance improvements will allow the infield to continue to play
more fairly in the future, but we’ll need more than one year’s worth of
evidence to conclude that.
If
you filter the first worksheet to only include the Las Vegas 51s stats, you’ll notice
that the average wOBA at Cashman has decreased by 30 points over the past 5
seasons, but remember that the first 2 seasons were played with a DH at home in
every game. Also, although this season saw another big drop in average wOBA at
Cashman Field, the ISO actually bounced back a little from 2014, so it's likely the suppressed BABIP played the biggest role in the drop off. Lefty walk rate was also down from previous seasons for whatever reason, and that's likely to bounce back in 2016.
The
stadium does not have a good reputation for player amenities, fan experience,
or MiLB.tv viewing experience, and it’s on the other side of the country, so
it’s not the ideal situation for the Mets AAA team. There may be some good news
coming (eventually), as there have been rumors of the 51s moving to nearby
Summerlin for a few years, and those rumors escalated to ‘preliminary
talks’ over this past holiday season. But who knows how long that will take
to get done, and if the Mets will still be playing in Las Vegas when it is (cross our fingers that they get out sooner than that!).
Binghamton Mets – NYSEG Stadium, Binghamton, New York

The
Binghamton Mets have been playing at NYSEG stadium since 1992, and the Mets
recently extended their contract with Binghamton through
the 2020 season, which wasn’t a given to happen in the middle of last
summer. The stadium has played about as fair as they come over the past 5
seasons, with measurements of 330 ft down the lines and 400 ft to CF. It hasn’t
been the hottest selling ticket in the EL, but the fans who do show up are
among the loudest I’ve heard watching MiLB.tv games. 2015 was the NYSEG MiLB.tv
debut, and while the production crew showed off some solid MiLB.tv camera
angles, they didn’t use the CF camera angle consistently, which can be frustrating.
Just
like with Cashman Field, 2015 represented a 5-year low for wOBA at NYSEG
Stadium, with a huge drop in production from lefties responsible in this case.
The drop in overall production from lefties only appeared in 2015, but the
lefty HR park factor has been trending down in each of the 5 years inspected
here, which probably explains why the biggest drop in 2015 rate production can
be seen looking at the ISO column above. The B-Mets have the largest influence
on these stats, and they didn’t receive much production from lefties in 2015,
but that doesn’t explain why the lefty HR park factor has decreased for 5
straight seasons, so I wouldn’t expect a full bounce-back from lefties at NYSEG
in 2016.
Overall,
Binghamton is probably the fairest minor league park in the Mets system, with
park factors consistently around 100 in a league with an ‘average’ run
environment. It’s important to keep that in mind when looking at Mets prospects
that suddenly see a boost in performance after a midseason promotion to Las
Vegas, especially in the power department.
St. Lucie Mets – Tradition Field, Port St. Lucie, Florida
 |
| Tradition Field at sunset |
The
Florida State League is known as more of a pitcher’s league, so while the
numbers at Tradition Field may not appear that impressive, the park factors
suggest it’s been a little more favorable to hitters than others parks in the
FSL. The outfield is 338 ft down the lines and 410 ft to CF, with the
center-field walls at 371 ft, so it takes a real drive to hit homeruns there, though
you wouldn’t believe that from the HR park factors for 2012-2013. No team in
the league has had MiLB.tv through the 2015 season, but the league did air the FSL
All-Star game (link has some gif highlights) from Tradition Field last
year, so perhaps it’s coming soon.
I
tuned in to St. Lucie Mets games on TuneIn often last year, and it seemed like
there were a lot of potential homerun fly balls that turned into outs at the
wall or doubles (especially for Michael Conforto). Radio announcer Adam
MacDonald suggested multiple times that the effect had been worse for lefties
in 2015, as the wind was often blowing in from RF, and the lefty HR and double park
factors would seem to agree with this – the HR park factor dropped, while the
double park factor increased.
For
St. Lucie batters, ISO numbers are definitely suppressed in this environment,
with the FSL having the lowest average ISO of all full-season leagues in 2015,
coming in at 0.089. That’s what lefties averaged at Tradition Field in 2015,
while righties were up to 0.093. This is important in the context of one Mr.
Dominic Smith, who fans were down on in April, but who rebounded to have a very
nice season in the FSL, and then just went wild over 60 PA in the AFL. Smith was
2+ years younger than the average age of the competition at both levels, yet
his FSL ISO was above average at .112 (including .150 at home), and his AFL ISO
was average at .149 – the AFL has better overall competition, so it’s not
surprising he slides back to just average power as a 20-year old. Smith also
posted a nice healthy .351 BABIP with St. Lucie, well above league average of
.302, which suggests he was consistently making good contact with the ball (as
Adam Mac would have me believe).
Overall,
Tradition Field plays pretty fair within the context of the FSL, but the league
as a whole favors pitchers, and this park is no different. Pitcher HR/9 numbers
are likely to be deflated by the league environment, which is something to keep
in mind as Mets prospects advance on to Binghamton and Las Vegas. For example,
after allowing only 1 HR with St. Lucie over his first 8 starts of the season,
Robert Gsellman would allow 3 HR in his first 7 starts with Binghamton before
settling in to allow just 1 HR over his final 9 starts. However, Tradition
Field’s fly ball factors have all been 104+, so even with a league average
HR/FB rate, the stadium would allow more homeruns than FSL average. Looking at the second worksheet above, it's interesting to note that fly balls have consistently been nearly as effective at Tradition Field as they have been at Cashman Field.
Savannah Sand Gnats – Historic Grayson Stadium, Savannah, Georgia

The
South Atlanta League gets a pitcher’s league reputation, but it was generally in the middle of
the pack among 2015 full-season leagues in the offensive rate stats I looked at
last
time. The same cannot be said of Historic Grayson Stadium, which probably
hosted its last season of affiliated ball in 2015, as the Sand Gnats franchise
was moved to Columbia, S.C. after the season. It’s unclear what type of
ballpark Spirit Communications Park will be, but I’m hoping it won’t favor
pitchers as much as Grayson did. It was only 310 ft down the RF line, 322 ft
down the LF line, and 400 ft to CF, but it played like a big park due to the big
walls from the RF foul pole to left-center field, which made it very tough for
batters to launch dingers, especially lefties.
For years I have read about Grayson
suppressing lefty power numbers, and the L HR park factors strongly confirm
this. It hasn’t been a picnic for righties either, but lefties have had a HR
park factor below 80 in 3 of the 5 seasons I have data on – in other terms,
lefties have had an ISO between .079 and .082 at Grayson in 3 of the 5 seasons
I have data on. Savannah had one major lefty power threat in 2015, and Eudor
Garcia put up an impressive .146 ISO in his 429 PA with the club (league
average was .116). While his ISO was still well above average .120 ISO at
Grayson, it’s clear that his overall power numbers were diminished playing half
of his games there. Eudor has other parts of his game to work on – he only
walked 5.1% of the time last year, his K-rate jumped to 22.1%, and he’s a work
in progress at 3B – but he might have the best lefty power in the Mets farm
system now that Conforto has graduated.
As I mentioned, righties haven’t
done much better in the power department at Grayson, with an average ISO of
about .095 in 4 of the 5 seasons inspected (it bottomed out at 0.080 in 2013). To
make things worse, righties have consistently done significantly worse than
lefties by BABIP and OBP, so their wOBA has been lower in each of the past 4
seasons. The Sand Gnats only had a few righty power threats in 2015, with
Wuilmer Becerra headlining the group. Becerra put up a .134 ISO last year,
including a .128 ISO at home, with a .351 BABIP overall (10th
overall in the SAL), which bumps up to .384 at home, so he was not slowed down significantly
by Grayson. The other big righty threat that spent most of the season with
Savannah was Vicente Lupo, and while his K-rate is frightening (39.9%), his
power potential will keep earning him some shots as a prospect for now. His
.168 ISO led the team, and was 17th among 109 SAL players with at
least 300 PA in 2015, and he posted the same BABIP as Becerra. At home, his ISO
dropped to a still well above average (for Grayson) .129, and his BABIP dropped to .336, so
his overall numbers were diminished playing half of his games at Grayson.
Michael Katz is a year older and slightly less extreme version of Lupo, but his
.156 ISO certainly helped the club over the final 56+ games. Grayson got to
Katz too, with his ISO dropping to .120 at home, but his BABIP taking a bigger
hit, from .347 overall to .305 at home.
In total, that's 3 of the Sand Gnats 4 biggest mashers from 2015 putting up considerably worse numbers at home, which is not ideal for prospect evaluation. Considering the extreme pitching environment, I’m glad the
Mets are moving out of Grayson, although it is a little sad to see them leave
Savannah without a minor league team (a collegiate
summer league quickly swooped in and signed a contract with the stadium for
2016 when it was finally announced that the Gnats weren’t returning, so at
least they’ll have that). It sounds like
Spirit Park should be a fair park, so hopefully we won’t have to keep
considering the park effects on Mets A-ball prospects in future seasons.
Brooklyn Cyclones – MCU Park, Brooklyn, New York
We are at MCU Park for the Brooklyn Cyclones game v Batavia be sure to #staytuned for coverage #MiLB #BKCyclones pic.twitter.com/o8cNThNOCu
— 1495Sports (@1495Sports) July 31, 2015
Short-season
league stats are small sampled and barely predictive, so it’s best not to dwell
on them too long, but we can still get a decent idea of how the parks play. MCU
park is 315 ft down the LF line, 325 ft down the RF line, and 412 ft to CF, so
there are some places you can hit a homerun, but it’s not easy in CF. Also of
note is that MCU park has used artificial turf since 2013, something Manager
Tom Gamboa used as an excuse for a few early errors from 14th round
draft pick Vinny Siena.
The
NYPL was one of the weaker run and hitting environments in 2015, and MCU Park
was a little stingy on runs even for the NYPL. Doubles and triples were about
average, which has usually been the case, but the triples park factor is up to
105 for the third time in 5 years. The lefty HR park factor has been 95 or
below in each of the past 4 seasons, but the lefty double park factor has been
above average in each season, so it’s likely our lefty prospects have been
robbed of some homeruns playing at MCU over the years. 2015 was a particularly
harsh season to hit at MCU Park, with the stadium OPS of .595 representing a
5-year low, and also 72-points below the league average .667 OPS. Of course,
the Cyclones poor overall hitting played a huge factor in the dismal
production, as they were one of the worst hitting teams in the minors – just
read the first page from any one
of these Cyclones game notes
to get an idea of how bad things were. One thing that stands out from the stats
worksheet above is that the BABIP at MCU Park has been .290 or below in 3 of
the 5 seasons I have data on, which is well below any of the other Mets minor
league stadiums.
Kingsport Mets – Hunter Wright Stadium, Kingsport, Tennesee
View at Hunter Wright Stadium tonight in #Kingsport @Kingsport_Mets #AppyLeague @MiLB pic.twitter.com/m3C9bFFRbS
— Jordan Conigliaro (@WCYB_Jordan) July 4, 2014
The
K-Mets home sample is even smaller than Brooklyn’s, and another thing to
consider with these short season league’s is the pool of talent. Many
short-season league players are playing in the minors or the United States for
the first time, and many of them won’t ever play at the higher levels. The APPY
league is middle of the pack by many run environment measures, and the K-Mets
play in a generally neutral run environment within the APPY league. Hunter
Wright Stadium is the name of their home ballpark, and it’s 330 ft down the
lines and 410 ft to CF. There aren’t many notable trends within the K-Mets
data, it just generally balances out to an average APPY league park. But it is
worth noting that it’s the only home park in the system below AA that doesn’t
favor pitchers.
One
thing that became clear looking at the league and park trends over the past 5
years is that offense has been declining across the minors during that time,
with offense not bouncing back in 2015 like it did in the majors. I only looked
at 6 of the 16 leagues in the minors, but it seems unlikely the trend is
limited to just those leagues with Mets teams. I’d expect the offensive trends
to be similar between the majors and minors, but one reason offense might’ve
continued to decline in the minors during the 2015 season was the further
expansion of aggressive shifting to the minor leagues. I’m sure teams have used
shifts in the minors before 2015, but it seemed like they were more common last
year, and eventually the topic started coming up during some of the minor
league broadcasts that I watched. I can think of a couple good reasons that it makes sense to expand shifting to the
minor leagues - some shifts have players playing way out of
position, so they might as well get reps there in the minors; similarly, it
would be better to learn whether a lefty masher can overcome the big pull shift
in the minors than wait for him to come up and struggle hitting into the shift
for the first time - so I wouldn't be surprised if they become even more common down there moving forward.
Wrapping
up the Mets minor league stadiums, there are 2 pitcher friendly parks (St.
Lucie and Brooklyn), 2 fair parks (Binghamton and Kingsport), 1 generally high
run environment park (Las Vegas), and one question mark in South Carolina that
is replacing an extremely pitcher friendly park. The way they are stacked, Mets
pitching prospects should have had a relatively easy time going through the
system at the lower levels, only to have one of the nastiest places to pitch
waiting for them at the highest minor league level. Alternatively, hitters
don’t catch a break until AA, especially with respect to homeruns, and then
play in a park and league that can be so stat inflating that it becomes hard to
separate player production and improvement from the park and league effects.
How NASA's James Webb Space telescope will shape the future of astronomy: https://t.co/ajlJH1VICJ pic.twitter.com/j1TZO0irC0
— Forbes Tech News (@ForbesTech) January 28, 2016

Leave your comment
Post a Comment